A few weeks ago we warned for a possible sudden move downwards in gold prices
Meanwhile gold has dropped more than $50/ounce and is now sitting just above $1600.
What’s next?
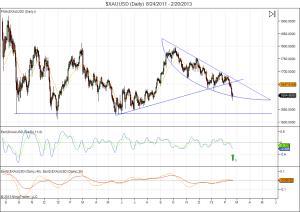
Here is the daily chart (click for larger image):
The recent price action is contained within a beautiful arc formation. Last week’s drop tested the bottom of the arc (~ $1590), but is holding up so far.
If this bottom holds and prices climb back above $1670 then I would buy.
I would rate this scenario a 30% probability at the moment. This will rise to 60% probability if gold is still above $1600 by mid March.
If gold goes lower, then last year’s bottom around $1530 becomes the next major support.
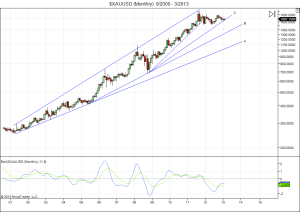
The longer term weekly chart shows us what to expect if gold falls below $1530 (click for larger image):
Line B would be the next support trendline, currently around $1400.
Next is line A, which offers support around $1100 this year.
Good luck,
Danny


or to say in other words is there anydaily /weekly/monthly cycles for sunspot to see declines ? tnks
Hi Roni,
There are many sites offering space weather and forecasts for geomagnetism.
Click on the “Solar Activity” link in the top menu bar.
There you will see some forecasts for up to 3 months in the future, coming from various sources.
The sun has a 27 day rotation cycle (called Barthel cycle), so there is often a 27 day peak-to peak rhythm.
That’s why again higher sunspot counts can be expected towards the end of March.
Danny
I know the site but lost there can not find a simple graph with a forecast thanks anyway
Are you sure you were looking at this page: https://lunatictrader.wordpress.com/solar-activity/
The first graph already shows you a 3 month forecast for sunspots number
Danny
tnk u danny very helpful i ll learn it and tell u what i think
hi
this week I noticed when the market declined, the number 130 in the sun spot in Solar activity box
can you tell please when there are solar storms and Value numbers Spot will go upwards? Is there any table like that moon phases in advance to track? Thanks