Stocks made another push higher last week and the S&P 500 has now recovered all its losses since the start of the year. Can it go higher? Why not? Can it go much higher? More on that further on in this post, let’s first have a look at the chart:
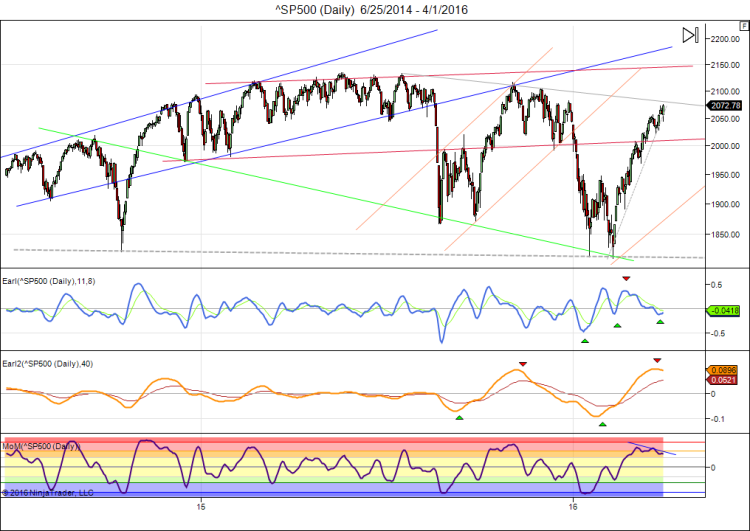
The S&P is back to levels last seen in late December. And it is also back to the obvious overhead resistance zone 2050-2130, which has kept the market in check throughout 2015. Will it stop the market again? My Earl2 indicator (orange line) has finally turned down, suggesting a pullback or correction is in the pipeline indeed. But the faster Earl (blue line) has just made a shallow bottom and is turning up. This suggests the market wants to go higher first. When there are mixed signals it is usually the faster Earl that pans out first. We are in a lunar green period, so a test of the November high is possible this week. I will keep an eye on my daily reversal levels for clues when a top may be in.
Most investors probably expect at least a good pullback at this point and that’s a reasonable scenario. But what if the market just forges ahead and climbs above 2150 without looking back? That would be shocking for many. Yet, it has happened before.
I started investing in 1986 and within one year I got caught in the ’87 crash. The media was full of comparisons with the 1929 crash and that made me very cautious, which helped me to miss out on most of the subsequent recovery. This stock investing sure didn’t look like an easy road to riches anymore. The first Gulf war in 1990 introduced another bout of caution in the stock markets, but not for long. By 1994 stocks were more than 30% above the levels from which they had just crashed 7 years before. All the newsletters I was reading were very bearish, so I bought put options, convinced that another crash was coming. And things went my way very soon, as there was a significant pullback in March. I didn’t want to sell too early, and the financial media had become even more bearish, so I held on hoping for much bigger gains when the inevitable crash came. But, of course, by summer stocks had gradually recovered for no good reason at all. I sold my put options in disgust, taking a loss on them, and was lucky to do so because the stock market was to double in the next 18 months.
The recent price action in the market as well as the current mood are reminding me of that time. Once again the market crashed and recovered. Once again the market has climbed 30% above the pre-crash highs, convincing many investors that another crash must be due. Once again investors’ mood has become depressed, even though the market is not far from new all time highs. And the price action has been very similar:
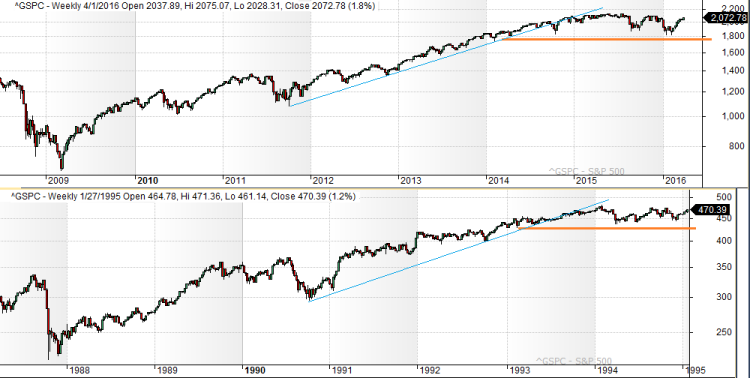
Does that mean it will continue the same? No, it doesn’t. Similar price patterns always break down sooner or later, we just don’t know when. In late 1994 stocks broke out to the upside and there would be no pullback worth talking about for more than a year. Innovation drove the market higher and it would take another 5 years to reach a major peak.
Innovation is still accelerating, so could we be in for a repeat performance? I don’t know, but I can’t rule it out because it has happened before.

nice analog danny !
if we make a new high, what is your target on spx? (price and timewise)
That’s hard to tell. But given the long sideways pattern that now stretches over 2 years for the S&P, a breakout to new highs (if not a false breakout that reverses instantly) would normally lead to a sizable move over at least 18 months, but possibly much longer.
Target would become 2350+ , again with much higher targets possible if the move goes much longer than 18 months.
In that case I will just ride out the move using my reversal levels, without focusing too much on price or time targets. That’s usually the best approach.