If you look at a long term chart of the Dow Jones Industrials it is interesting to see how symmetrical the advance since the 1932 depression lows has been.
You could turn the chart upside down around a point in late 1974, and it would look almost exactly the same.
This chart lines out some of these symmetries (click for much larger image);
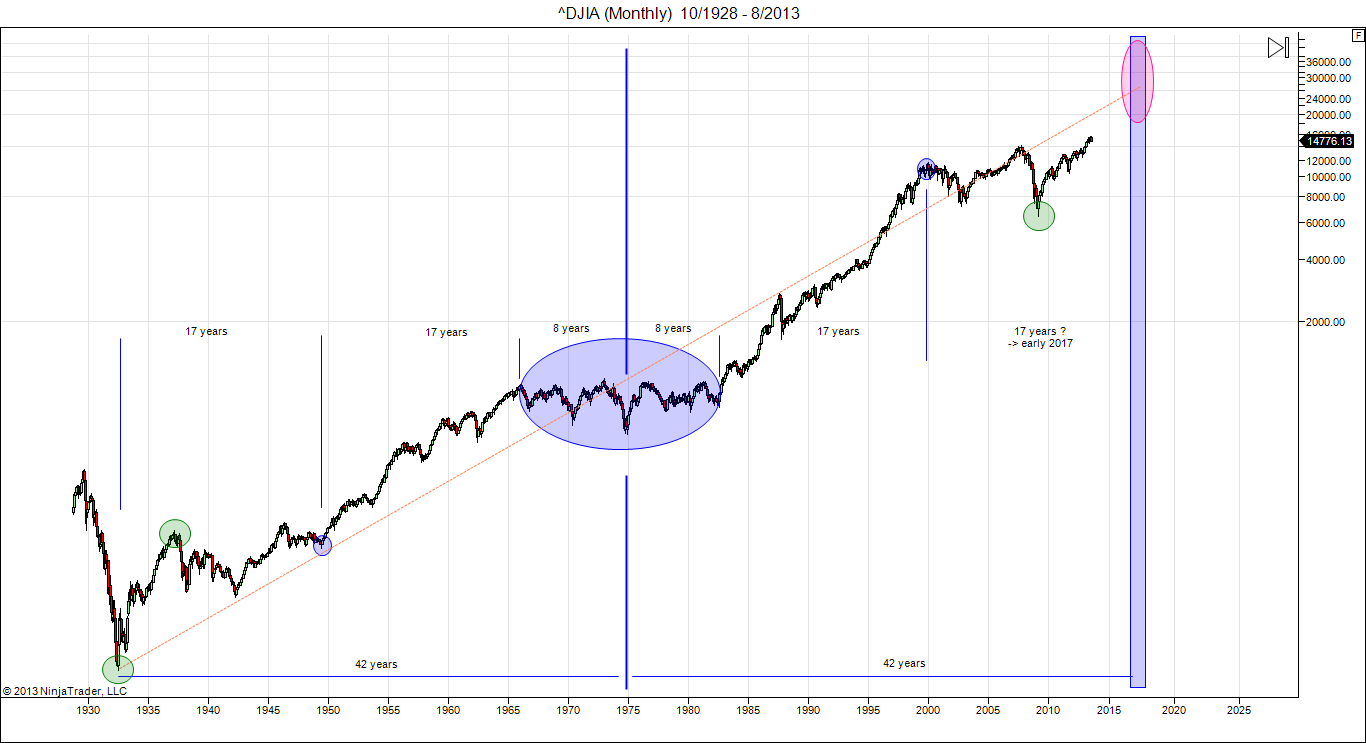
If this symmetry is to run its full course, then it asks for a major high in late 2016 or early 2017. Feasible?
If the symmetry continues then the price action since the year 2000 peak should resemble the price action of the first 17 years since 1932, but mirrored. In the next chart I have done that exercise (click for larger image):

Lining up the 1949 bottom (becomes a peak in the mirror image) with the early year 2000 high gives a good match. While there are obvious differences, we can see that most tops and bottoms line up well.
Overlaying it directly we can get this (click for larger image);

Here I have matched the 1949 mirror high to the 8000 level for the Dow, which puts the correction low at 6470, which was the actual low in 2009. That sets out an upside target of 31130 by the end of 2016.
By the way, I have always thought that 8000 would have been the natural high for the Dow in 2000, if it hadn’t been for easy Al’s monetary policies.
Long term trend lines that have been in play for decades are also showing a convergence around 32000 by late 2016 (click for larger image):

Zooming in on the potential price targets:

The most optimistic target is just above 50000, not one I consider very realistic, unless we get hyperinflation.
The trend channel that started in 2009 is targeting 30000 by late 2016. This advance happens to be climbing at exactly the same rate as the 1994-2000 bull market. Can this be kept up for three more years?
A few conditions will need to be met for this very bullish scenario to remain in play:
1) The current correction has to be shallow and cannot venture too far below 14000 before recovering.
2) The green overhead resistance line, connecting the 2000 and 2007 highs, will have to be overcome and left behind. That’s not going to be an easy feat. But with all the ongoing QE, who knows?
3) This breakout above 17000 would have to come by summer 2014.
If we get a deeper correction to 12000 or something, or if the market fails to break above the green resistance line, then 19410 becomes a viable lower target to be reached in 2016.
In all these cases, a 2016 top would mean the end of this symmetric pattern, and may be followed by a 1930s style crash and depression. That would take the Dow all the way back down to 4000-5000 by 2020.
Let’s just see what happens.
Danny
Related articles


32000 has already been reached
True. But consider that this post was written in August 2013 :-)
This is very interesting symmetry. If your right and we begin a brutal bear market that drops below the 2009 lows, most of America will be broke! NOBODY believes this is a possibility which is usually when it happens. It’s like 2007/2008 all over again but much, much, much worse.
We will see what happens after this time symmetry ends. I will post an update to the charts and review possible scenarios in my next weekend post.