Lunar cycles in stock and commodity markets have been observed since the days of traders like W.D. Gann, and were probably used by many others secretly. Is there an accepted scientific explanation for it? Not really, but I have posted some thoughts and hypotheses in the blog over the years, e.g. here.
For investors who want to work or experiment with lunar cycles in their own trading we have developed a convenient software program:
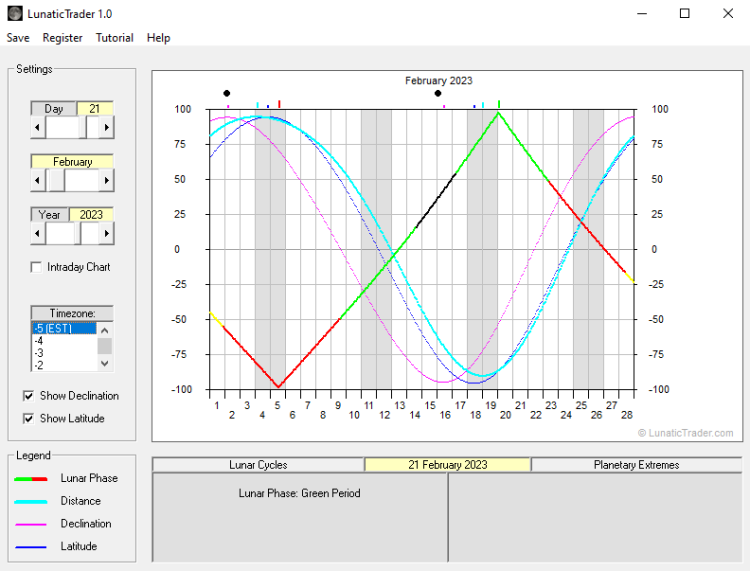
LunaticTrader 1.0 calculates all moon phases and lunar cycles which are relevant in the stock market and displays them in monthly and daily charts. It helps you to anticipate the market action in the day(s) and weeks ahead, and it takes no more than a few minutes of your time. Includes tutorials for use of the program.
Download here via Dropbox (zip file): lunatictrader1
The free trial shows you the lunar cycles since 1900. Registration will unlock all the cycles charts until the year 2100.
Registered users receive:
- lifetime license for the software (password sent by email).
- bonus ebook with tips and strategies for using the Lunar cycles.
- free upgrades and customer support.
The software is designed to work on Windows PC (Win 98, XP, Vista, Win 7, Win 8, Win 10, Win 11).

Download here via Dropbox (zip file): lunatictrader1

Danny Black period is sama like red and yellow is like green ? Any differents ?
Black is a sub-portion of the green period. Yellow period is a sub-portion of the red period. New users shouldn’t concentrate too much them. The ebook that comes the program gives more information about the black and yellow periods.
Danny
do you have any analysis on X (US steel).
Hi,
The lunar cycle study is used for the market as a whole, not for for specific individual stocks. Of course, most stocks largely move with the overall market a good deal of the time.
I publish technical study for a large number of stocks with the reversal levels, which are posted very regularly on this blog. So, you will find X here: https://lunatictrader.wordpress.com/2015/01/10/weekly-reversal-levels-for-january-10-2015/
Danny
Thanks, for sharing information with us. I am looking for stock charting software. How much it cost me after trial.
Hi,
Our software is not a charting program.
If you are looking for stock charting software, just download the free version of NinjaTrader: http://www.ninjatrader.com/
It comes with free end of day data and offers all the charting you can ask for. Most of the chart on this blog are made with NinjaTrader.
Danny