Stocks have basically gone sideways so far this month. Since the November 9 drop the S&P 500 is trying to climb back, but it looks like a tired effort. Meanwhile bullish participation continues to weaken, as reported in my weekly reversal levels outlook.
The lunar green period is about to end, so it will be interesting to see what comes next. Here is the current S&P 500 chart:
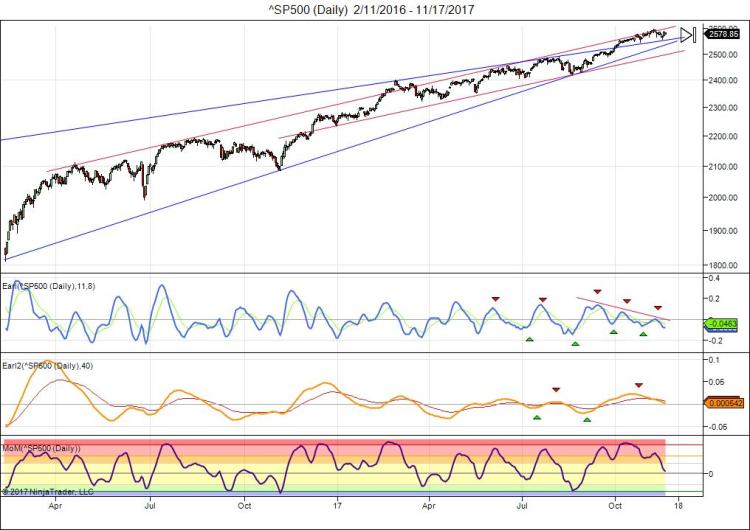
This index keeps pushing into an important trendline. But my Earl indicator is showing a multi-month bearish divergence. And the slower Earl2 (orange line) keeps moving lower with no signs of a bottom. The MoM has cooled off since peaking into the +8 zone in mid October.
While all those warning signs have not resulted in any significant downside action so far, it doesn’t mean the market is becoming safe. Sometimes the real drop comes at the very end of a longer sideways period.
A few readers have asked about my bitcoin targets. Since my August post, the next target of $6430 was reached quickly. And I had one higher target, posted on Twitter a few months ago:
With bitcoin continuing its ascent, our next price targets are $6430 and then $9374. $BTCUSD pic.twitter.com/NdJ9zHGhwa
— LunaticTrader (@lunatictrader1) October 13, 2017
I would not be surprised to see stock markets and bitcoin reach important peaks together, before entering “cooling off” phases. With bitcoin now well above $8000 a move to my higher target at $9374 looks realistic here, and yes an overshoot to just below $10 is possible too. I would expect some serious profit taking if $10k is approached. Here is an updated chart:

Bitcoin is bumping into an overhead resistance line and a jump above $9k would look like a breakout. But false breakouts are a fairly common way of ending major bull markets. A one or two day jump to $10k that is quickly reversed would be a textbook blow-off peak. The ELC indicator has peaked out already and such a move would paint a clear bearish divergence. I will keep you posted on Twitter.

I hear you there Dan. On all the points you’ve made – the disagreement and the price targets (so to speak).
Use my own trend system, I am seeing the rally start to weaken quite a bit with breadth being fairly atrocious as new highs are made and the lows are made pre open and on next to no volume. My own support lines are approx. 2512 and 2485. And I agree with you. We’ve not had a real meaningful and healthy correction in a while and so yes, a 3% can easily become 5% which can become 10%. I am in agreement. Might lead to a panic sale.
But before that, my concern remains a parabolic move upwards when the last vestiges of common sense and final bears also capitulate. Its interesting that 2440 is a >5% correction from highs … I have started to get very nervous on long positions and pared back tremendously and initiated a few long VIX positions. So far, its not been pleasant, but we know, these things can turn on a dime.
Thanks for all the tweets and articles. I try to stick to my own process as much as possible, but you and a few other blogs are ESSENTIAL reading for me!
Best, JD
Good points. Sticking to your own process while taking a look here and there is exactly how it should be imo. That implies taking responsibility for your own trading and it’s the best way to become better over time.
A final sharp move upwards (parabolic) is always possible, but it is rarely my base scenario because more often than not such a blow-off does not come and the multi-year bull market just peters out slowly (example: 2007 peak). Betting on such a sharp advance can be very rewarding, but it is a bet hat rarely pays off.
In my own trading account I also have more cash now than I have had for years. The risk/reward for new longs just stinks at this point.
Dan
Dear Danny (aka Lunatic Trader),
Big fan of your work and a lot of respect! Love the fact that you said “disagreement also welcome” – class act!
Just posting with a quick doubt – I am in agreement with you on SPX (I don’t trade or understand Bitcoin).
On SPX, I am at ~2440 as a target. Is that the range / target you envision?
Best regards, JD
Hi JD.
Thanks for the thumbs up.
Inviting disagreement is not so much about being a class act (or trying to). I think that readers should always explore different sides of the coin after reading my articles ( or any articles). After reading something I always ask myself: how is this true? and how could the opposite be true? I hope my readers do the same and that’s why disagreement is welcome.
It is important, because investors who do not consider the opposite hypotheses of what they just read somewhere will not have a good plan B in place for when the given scenario does not pan out.
As for SPX target. In my work I try to focus mostly on being on the right side of the market. The eventual extent of moves will reveal itself while I stay on the right side of the market. So price targets are a tertiary consideration, mostly used for scenario exploration.
In this case, if SPX starts declining from here, we see some important trend support in the 2500-2550 zone. Everything is possible, but if the red line that has supported SPX all year gives way then I would expect a larger drop. We haven’t even had a 3% drop in a long time, so next time we get a 5% drop I think it will easily become a >10% drop. 2440 would be a >5% drop from highs already.
Dan