Markets have continued to move in line with expectations.
Most major indices remain near overhead resistance lines, but there is no breakout to the upside (yet), and meanwhile we have entered a lunar Red Period.
Here is the Nasdaq chart (click for larger image):
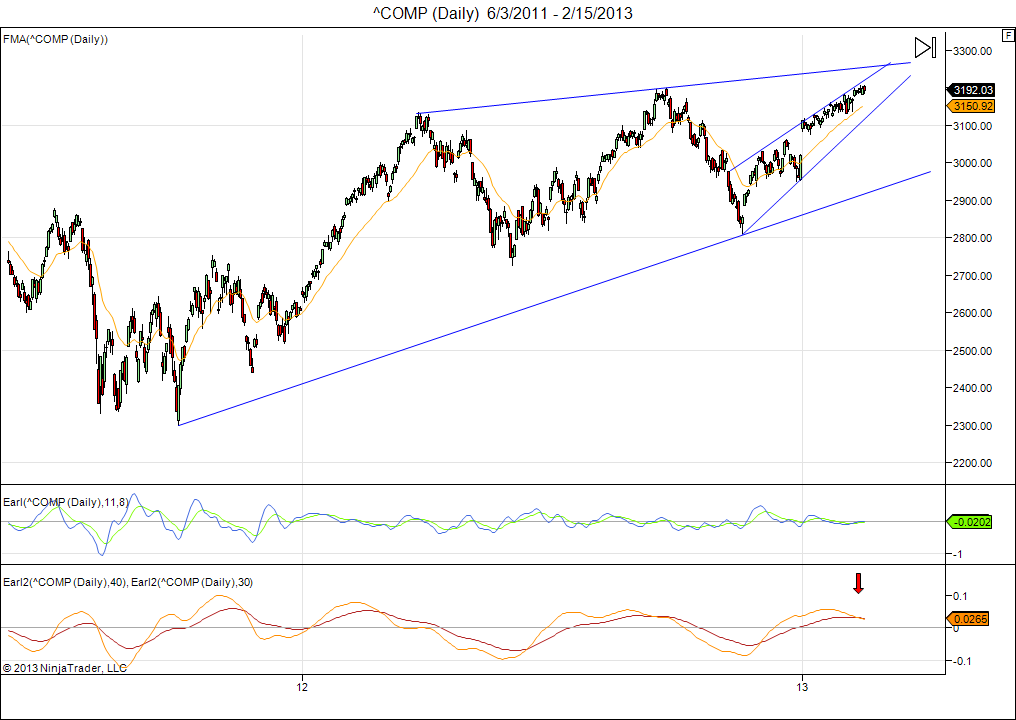
This market has reached our 3200 target, but seems to struggle to go higher, as we expected. I continue to look for a minor pullback in the next weeks and then another rally attempt in early March.
The Earl2 indicator is now clearly turning down. This means that any new highs we may see in the coming weeks, will be opportunities to sell and take profits. By the time the Earl2 bottoms out we will likely be able to buy at or below the current levels.
This means we should at least tighten our stops and be ready to get out as soon as a broader decline sets in.
Currently, a close below 3140 would be a strong indication to get out.
Today I also want to introduce something new, which I have been working on for a couple of months.
This is the “LT wave” chart (December through to March 2013):

The purpose of this wave chart is to spot shorter term moves (a few days) and to identify potential peaks and bottoms in advance. It also helps to estimate the strength or weakness of upcoming lunar red and green periods.
The lunar cycle is a major ingredient in this chart, but not the only ingredient. There is a “secret sauce”, so to speak.
So how to use it?
The orange line shows the daily signal, while the blue line is obtained by applying a 3 day smoothing filter, and the yellow line uses a 9 day smoothing. Values above 1 indicate strength, below 1 suggests weakness. I mostly use the blue line.
For this week the LT wave suggests weakness until Wednesday-Thursday, but Friday shows a strong upwards spike, which will be the peak value for February. In March we will get peak values on the 12th and 13th. If we get new highs on any of these days, then it are supposed to be good chances to take profits, or initiate positions to benefit from a downside move.
Let’s see how it pans out.
***
As chart of the week we take a look at the Euro vs US$ (click for larger image):

The Euro has dropped back from its recent peak, and my Earl2 indicator is turning down. The shorter Earl is well below zero, which means we are likely to get an upward bounce first, before turning down and fall further.
So, look for the Euro to hold up until well into March, then probably another leg down (and the Eurozone crisis back in the news)
Good luck,
Danny

Danny……I am liking your LT wave chart after today! Let’s see some more! Thank you, Eric