It is human nature to look for patterns in the world around us. The ability to recognize and remember patterns has been crucial for our survival as a species. But the same ability has also led people to look for patterns in the sky, patterns in recorded history and patterns in stock charts. This has led to (and fed into) a belief that history repeats or at least rhymes. But is that so? Or is it just that we would feel extremely uncomfortable in a world that doesn’t really repeat or rhyme?
Sure, we can find many classic examples of history rhyming and we can pull up plenty of stock or sentiment charts where a given pattern led to a similar outcome in the market. But maybe we have just overlooked the equally many cases where history didn’t rhyme at all and just bluntly produced a totally different outcome. If history only rhymes in 50% of the cases, then does it really rhyme?
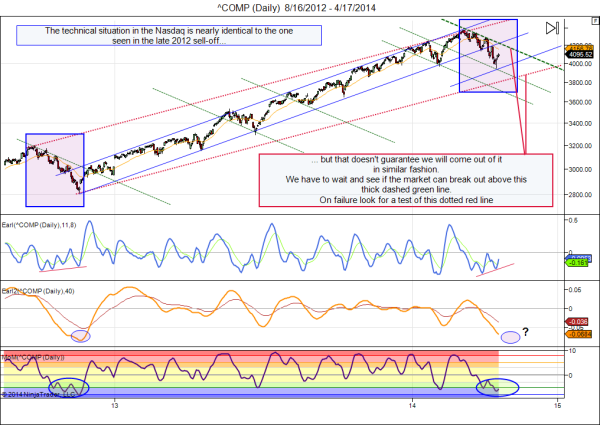
This question is relevant for the chart pattern we see emerging in the Nasdaq right now (click for larger image):
The recent price action in the Nasdaq is very similar to the sell-off we got in late 2012. And we are getting an identical setup in all my technical indicators. Bullish divergences are appearing in the Earl indicator while the slower Earl2 appears close to a major bottom. Meanwhile my MoM momentum indicator is forming a series of lows in very oversold territory, just like it did in 2012. So, history is ready to rhyme, right?
Well, as you can probably guess, I am not that sure. I don’t trust my indicators that much that I allow myself to think that a similar setup WILL lead to a similar outcome. I think it is really important to appreciate and respect the ability of nature and markets to produce a totally different way forward from what looks like an identical situation. And in that regard it doesn’t really matter whether you are looking at patterns in the sky, technical indicators, sentiment readings, economic numbers or just tea leaves. Because, even if history does indeed rhyme from time to time, it is crucial to realize that history has an equally strong tendency to SURPRISE!
So, to answer my own question. In reality history does two things really well: it rhymes and it surprises. It rhymes when it is not surprising, and it surprises when it is not rhyming. And most of the time we are rather clueless what will happen next, a piece of rhyming or a portion of surprising. It is a classic Yin-Yang thing and if we are only looking for history rhyming then we are watching only one side of the coin. A trader who is ready for history surprising will not really be surprised. And that’s why a trader who doesn’t trust his indicators and who doesn’t know where the market is going is actually in the strongest position to trade. That’s the traders’ paradox.
The recent eclipse lunar red period produced a loss of 181 points in the Nasdaq. A nice case of history rhyming, as eclipse red periods have a history of showing serious downturns. We now enter an eclipse green period, with the solar eclipse coming on April 28th or 29th (depending where you are on the planet). Eclipse green periods have a history of being very positive for stocks, generating above average profits. Will history rhyme? Or will it surprise? As always, only time will tell.
Your market agnost,
Danny


